
Meteringonline 3
Welcome to MOL
Meteringonline™ (MOL) is an innovative web based Meter Data Management (MDM) platform.
For our utility and electricity reseller customers MOL provides an integrated platform, delivering reliable and accurate metering and revenue management facilities. The system allows them to more easily, efficiently and reliably obtain and use advanced metering intelligence to improve customer service, enhance operational efficiency, and increase revenues.
MOL provides a tool for our large energy customers, which include industrial, retail and commercial organisations, to monitor and visualise their energy consumption in great detail, enhancing their energy awareness and allowing them to contribute to a greener environment. Empowered to act upon any inefficiencies, our customers become highly motivated to rationalise their energy consumption, leading to considerable reductions of their total energy costs.
Meteringonline (MOL) grew out of a simple premise: "If you cannot measure energy use, you will not be able to make much headway in reducing your energy footprint.”
MOL is an innovative web based Meter Data Management (MDM) platform that allows users to to monitor and visualise their energy consumption in great detail, enhancing their energy awareness and allowing them to contribute to a greener environment. MOL empowers users to act upon any inefficiencies and to rationalise their energy consumption, leading to considerable reductions in their total energy costs.
MOL does not look or behave like any other web application you might be familiar with. MOL has a rich graphical user interface, called the MOL Desktop, which is much more similar to an operating system for a personal computer than a standard web portal.
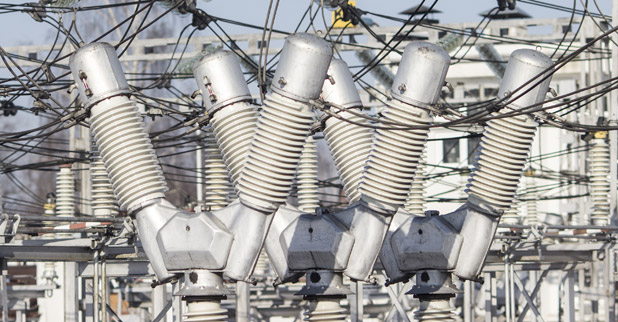
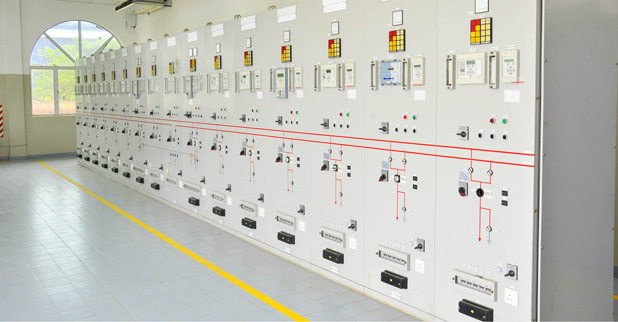
MOL offers a systematic and automated online approach to managing electricity, water and gas consumption, both at supply points to manage actual costs as well as within the industrial plant itself, particularly where costs and efficiencies need to be monitored for large-scale production lines with a great number of manufacturing procedures and steps are involved or divisions within the organisation with separate cost centres must be separately accounted for.
MOL uses state of the art smart metering data acquisition technology to communicate with utility meters automatically. Metering data is converted into metering information with reports and graphical interfaces to allow commercial and industrial customers to better understand their energy usage and improve business performance. Billing information is generated monthly and seamlessly integrated with the Utility's billing system.
MOL provides a comprehensive sub-metering system for multi tenanted commercial buildings such as shopping malls and commercial buildings. Billing information for tenants is provided to the property manager in electronic format which integrates seamlessly with the existing billing system used. A powerful suite of performance reporting facilities is provided.
MOL provides an ideal platform for utility managers of retail outlets charged with the responsibility of managing utility costs for an entire national chain of outlets. The system provides powerful aggregation and reporting facilities to allow the utility manager to assess the performance of each outlet or group of outlets against pre-determined benchmarks.